Introduction
In this article I will show you how you can analyse a team result in a given premier league season using pandas. Given I am a Manchester United fan I have picked Manchester United, surprise!
The season that we will be targeting is 2018/2019 season simply because its data is available not for any other reason.
Background
I was always fascinated by the statistics and analysis that is displayed during football matches and in match analysis programs. As such I have decided to try to analyse some football data using pandas.
The dataset is available here
Preparing dataset
Before I can work with the dataset I need to prepare it by removing certain columns that I don't need for my analysis. This is a good practise as it will allow you to focus on the data that you want for your analysis. Please refer to this article for more explanation about the operations used in trimming down dataset.
# Explore data
df.shape
df.columns
df.describe()
When running these commands I noticed that there are lots of columns to do with predictions and odds, so I opted to remove them because I will not use them. I have also filtered the data down to include only Manchester United games. homeFixtures holds home games and awayFixtures holds away games.
# Remove all betting and predictions columns
noPredictionColumns = df.drop(df.iloc[:,23:], axis=1)
unitedFixtures = noPredictionColumns[(noPredictionColumns.HomeTeam == "Man United") | (noPredictionColumns.AwayTeam == "Man United")]
homeFixtures = unitedFixtures[unitedFixtures.HomeTeam == "Man United"]
awayFixtures = unitedFixtures[unitedFixtures.AwayTeam == "Man United"]
Dataset analysis
Now I have the data that I want I can go ahead and start extracting the statistics that I want
Total goals scored
The following will give me total goals scored
homeGoals = sum(homeFixtures['FTHG'])
awayGoals = sum(awayFixtures['FTAG'])
print("Total goals: ", homeGoals + awayGoals)
Total wins/lose/draw
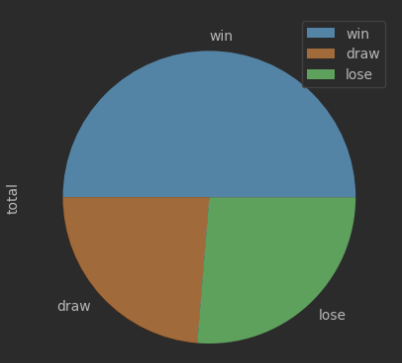
Here I am getting homeResults and awayResults then adding total wins/loses/draws from both datasets to get the total for each.
homeResults = homeFixtures['FTR'].value_counts().rename({"H": "Win", "D": "Draw", "A": "Lose"})
awayResults = awayFixtures['FTR'].value_counts().rename({"H": "Lose", "D": "Draw", "A": "Win"})
totalWins = homeResults['Win'] + awayResults['Win']
totalDraws = homeResults['Draw'] + awayResults['Draw']
totalLose = homeResults['Lose'] + awayResults['Lose']

resultDf = pd.DataFrame([totalWins, totalDraws, totalLose], index=["win", "draw", "lose"], columns=['total'])
resultDf
I can also plot this data frame using pie chart
resultDf.plot(kind="pie", subplots=True)
Goals against
# Total goals against
goalsAgainst = sum(homeFixtures['FTAG']) + sum(awayFixtures['FTHG'])
print("Total goals against: ", goalsAgainst)
# Average goals against per game
averageGoalsAgainst = (homeFixtures['FTAG'].mean(axis=0)+awayFixtures['FTHG'].mean(axis=0))/2
print("Average goals against per game: ", averageGoalsAgainst)
This will output the following:
Total goals against:  54
Average goals against per game:  1.42105263157894737
Goals for
# Total goals for
goalsScored = sum(homeFixtures['FTHG']) + sum(awayFixtures['FTAG'])
print("Total goals scored: ", goalsScored)
# Average goals scored per game
averageGoalsScored = (homeFixtures['FTHG'].mean(axis=0)+awayFixtures['FTAG'].mean(axis=0))/2
print("Average goals scored per Home game: ", homeFixtures['FTHG'].mean(axis=0))
print("Average goals scored per Away game: ", awayFixtures['FTAG'].mean(axis=0))
print("Average goals scored per game: ", averageGoalsScored)
This will output the following:
Total goals scored:  65
Average goals scored per Home game:  1.736842105263158
Average goals scored per Away game:  1.6842105263157894
Average goals scored per game:  1.7105263157894737
Most goals scored in a game
 Most goals scored in a game
mostGoalsHomeIndex = homeFixtures['FTHG'].idxmax()
mostGoalsAwayIndex = awayFixtures['FTAG'].idxmax()
print(f"Most goals scored in an away fixture was {awayFixtures.loc[mostGoalsAwayIndex]['FTAG']} against {awayFixtures.loc[mostGoalsAwayIndex]['HomeTeam']} on {awayFixtures.loc[mostGoalsAwayIndex]['Date']}")
print(f"Most goals scored in a home fixture was {homeFixtures.loc[mostGoalsHomeIndex]['FTHG']} against {homeFixtures.loc[mostGoalsHomeIndex]['AwayTeam']} on {homeFixtures.loc[mostGoalsHomeIndex]['Date']}")
This will output the following:
Most goals scored in an away fixture was 5 against Cardiff on 22/12/2018
Most goals scored in a home fixture was 4 against Fulham on 08/12/2018
Summary
In this blog I went through analysing premier league data set for season 2018/2019 then I extracted certain statistics for one team namely Manchester United.